

Enhancement
Export charts and tables to CSV in Webflow Analyze
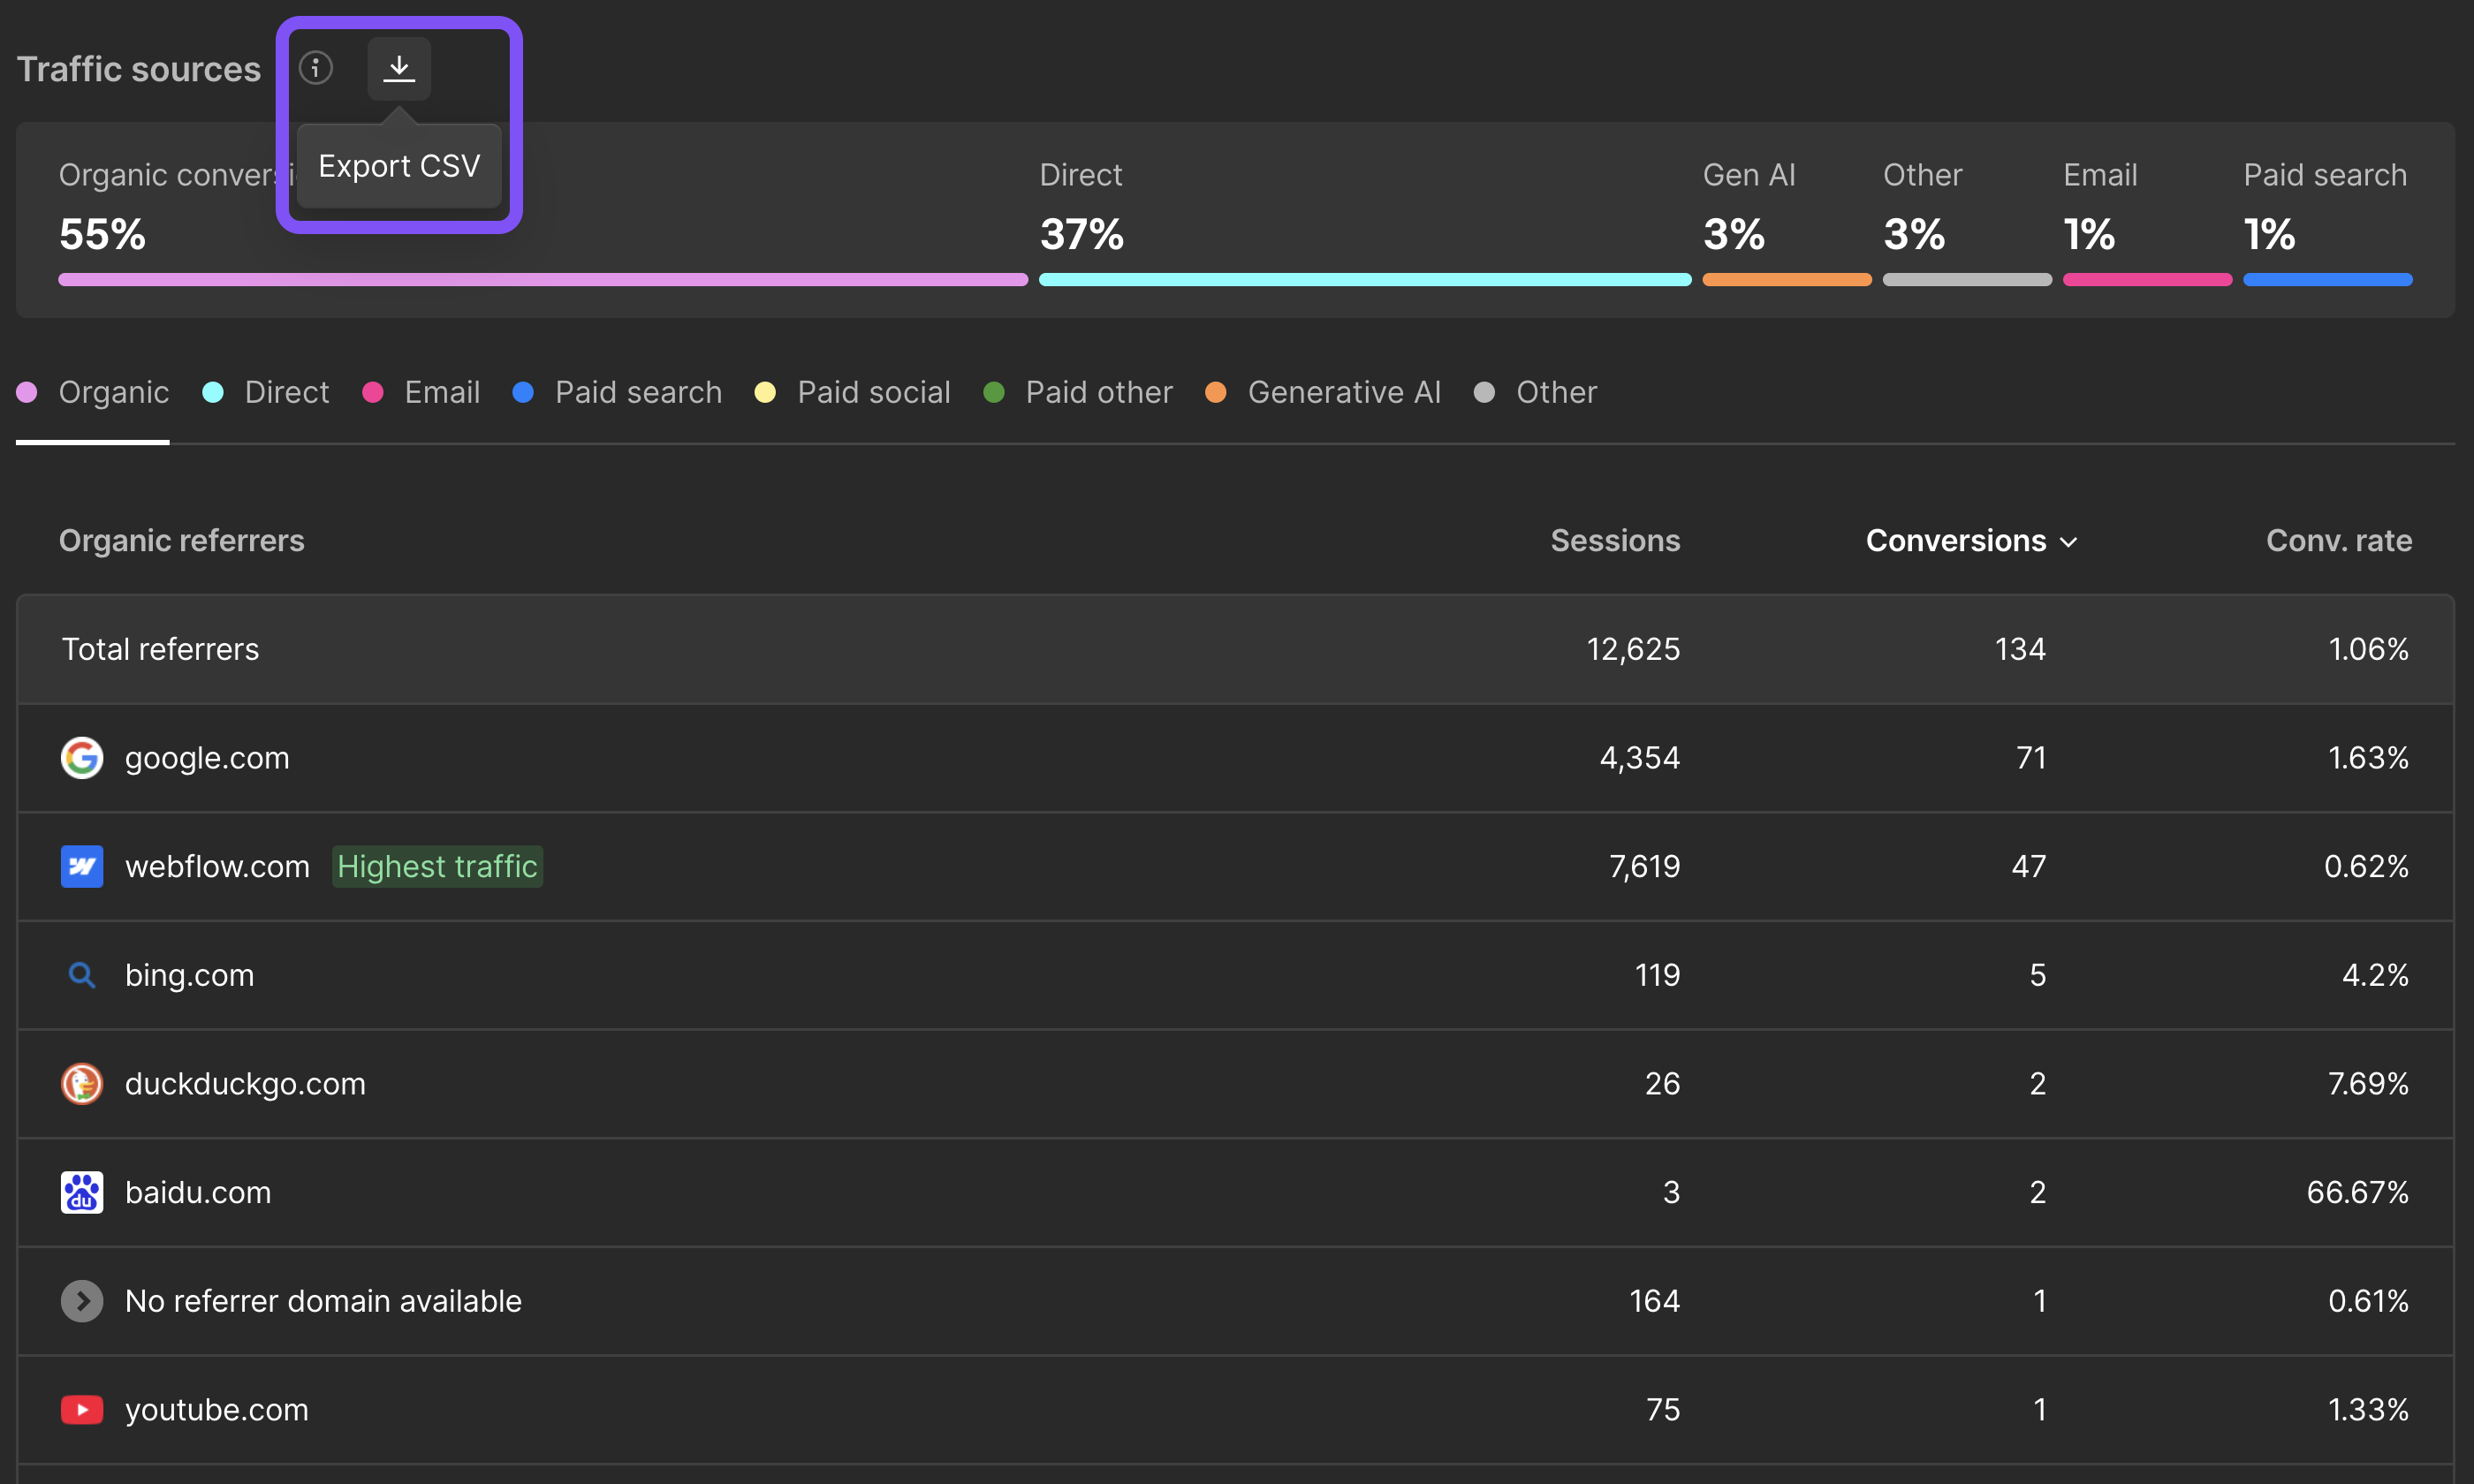
Export any chart or table in Webflow Analyze to a CSV file with one click. Share site performance data with stakeholders or analyze it further in spreadsheets.
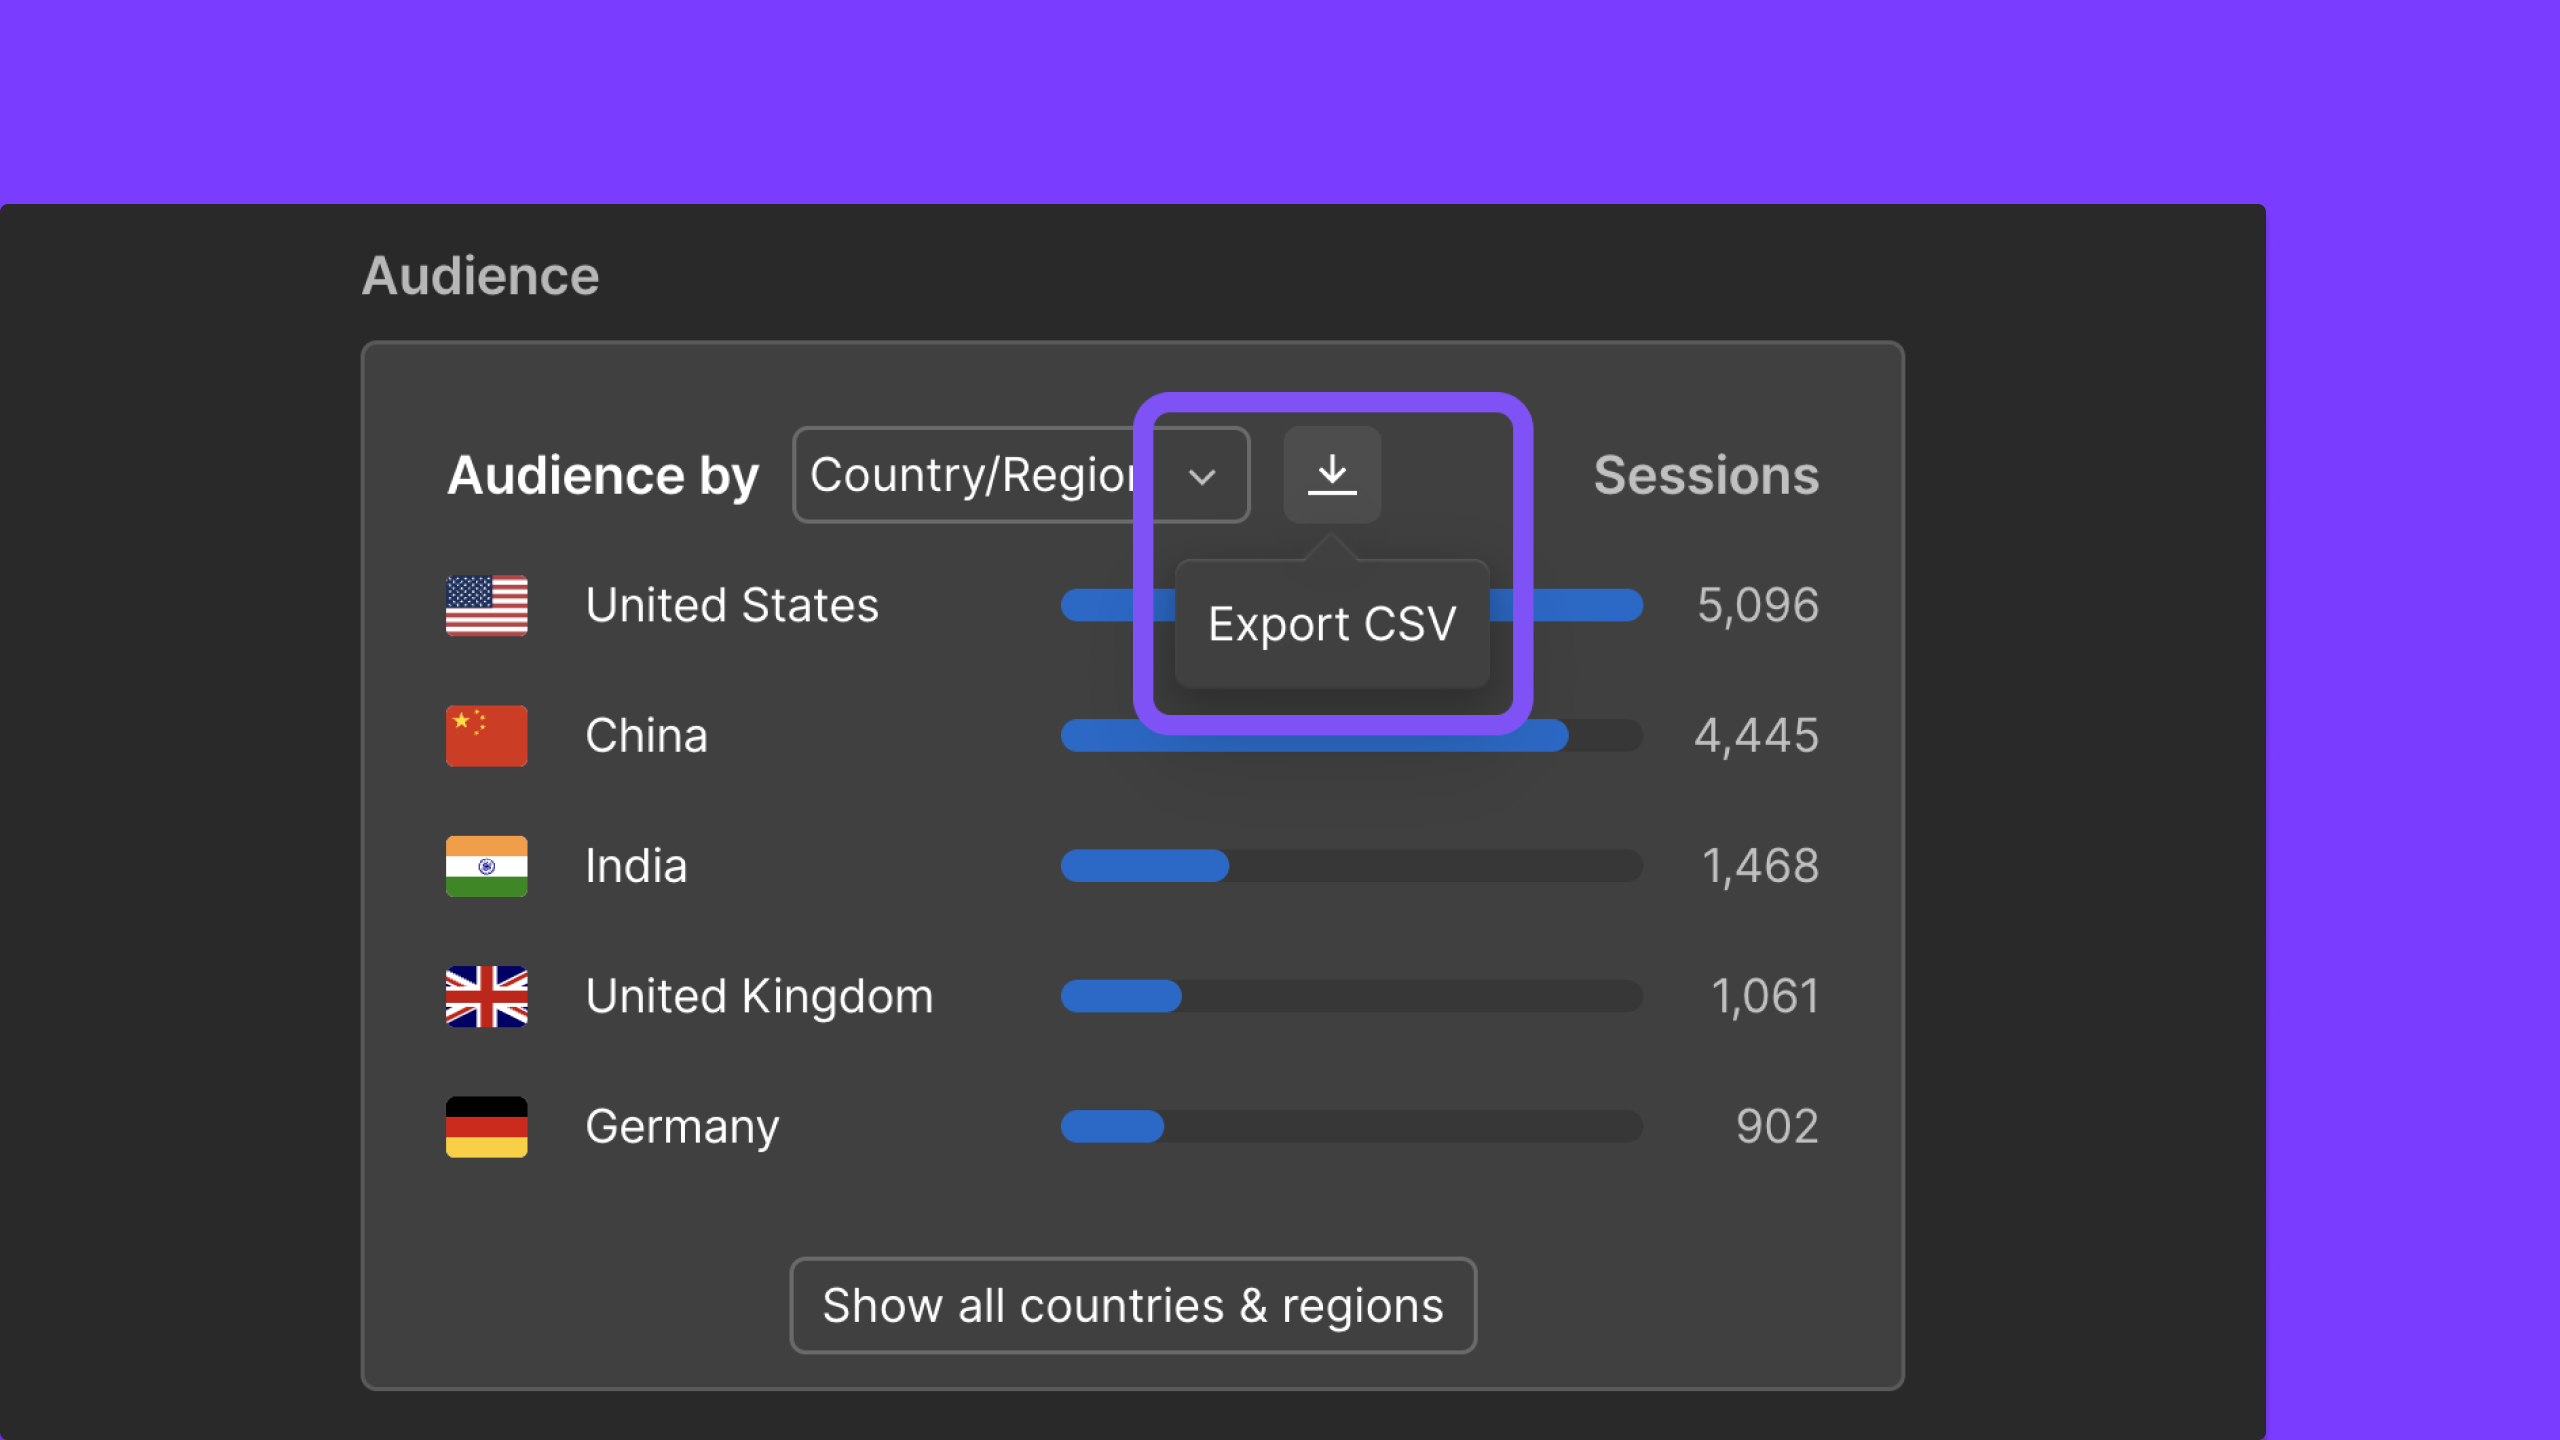
If you've been looking for a way to get your Analyze data into a spreadsheet — for a client report, a team shareout, or deeper analysis — now you can! Export any chart or table in Analyze to a CSV with just a single click.
Each CSV includes a metadata header with the site name, date range, and any active filters — so you always know where the data came from.
What you can export:
- Site Overview — Sessions/Visitors time series, Bounce Rate, Time on Page, Audience charts (Country/Language/Device/Browser)
- Pages — Page list table, Page Details (sessions time series, bounce rate, traffic sources, performance metrics)
- Goals — Conversion rate time series, Traffic sources, Audience information (countries + languages)

Whether you need to share a weekly report with a client, compare site performance over custom date ranges, or simply crunch numbers in a spreadsheet — your Analyze data is now just a click away.
CSV exports are available now for all Analyze customers. To get started with Analyze, try it out today, or learn more about Webflow Analyze.
Related updates


Commencez gratuitement
Essayez Webflow aussi longtemps que vous le souhaitez grâce à notre plan Starter gratuit. Achetez un plan de site payant pour publier, héberger et débloquer des fonctionnalités supplémentaires.
Essayez Webflow aussi longtemps que vous le souhaitez grâce à notre plan Starter gratuit. Achetez un plan de site payant pour publier, héberger et débloquer des fonctionnalités supplémentaires.